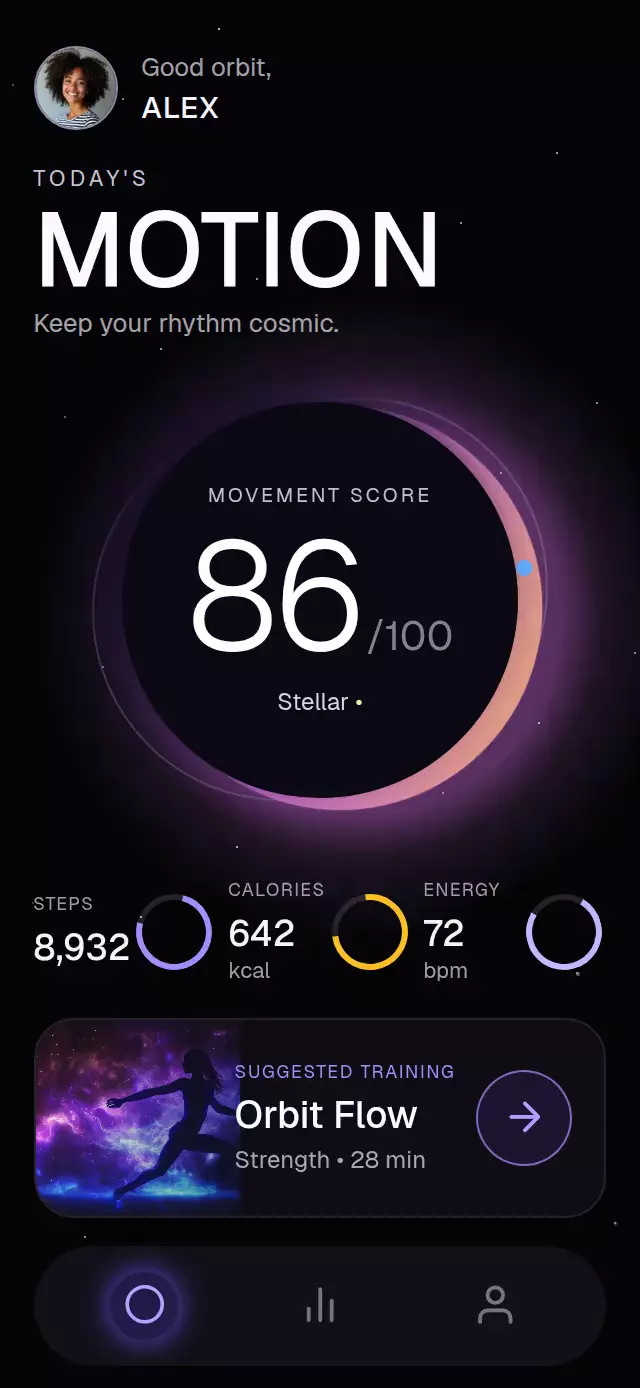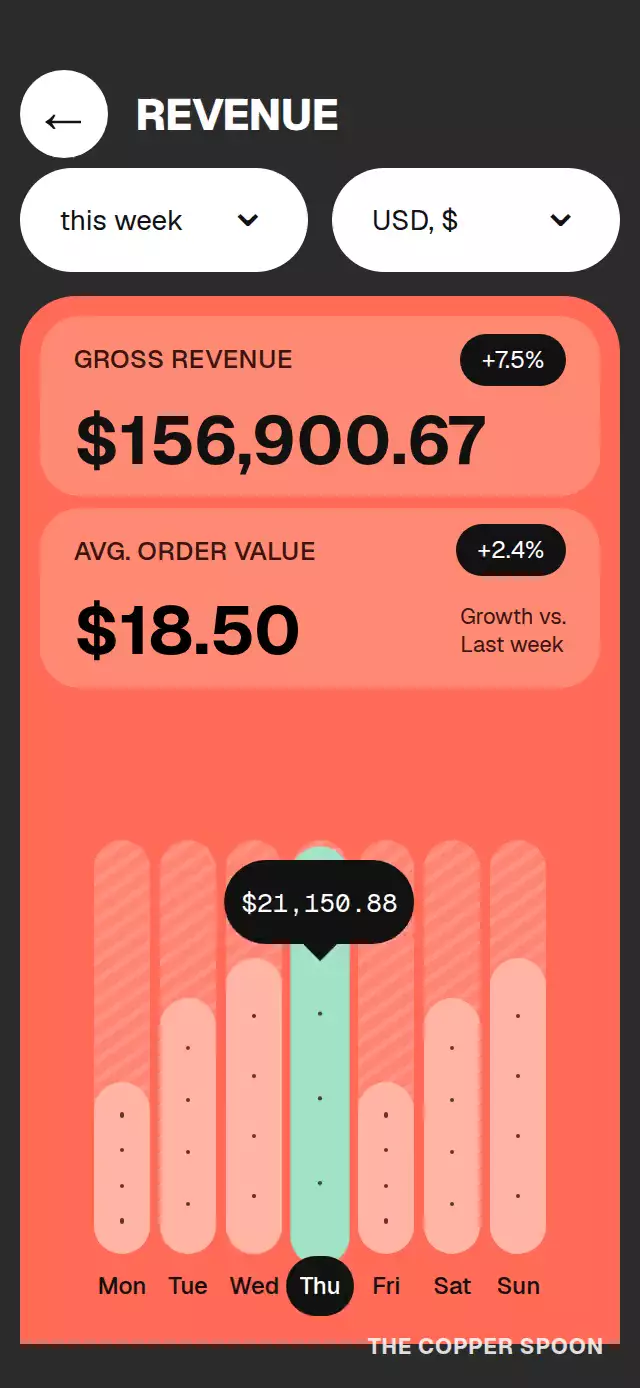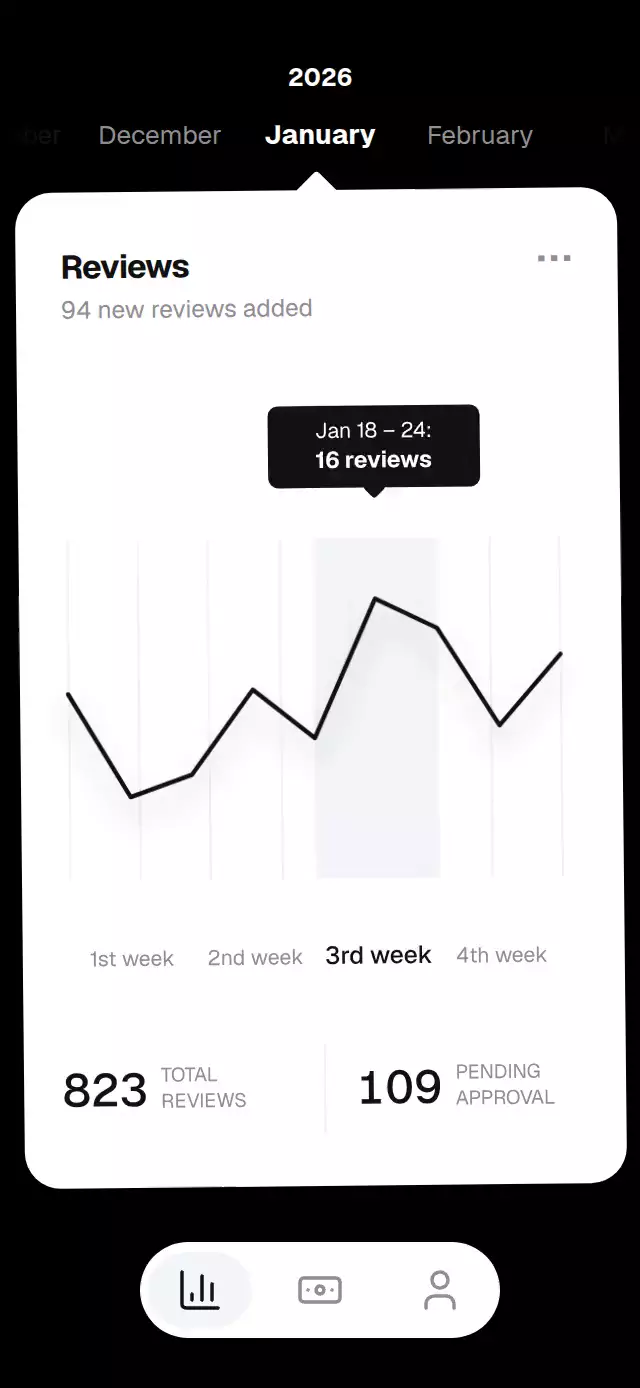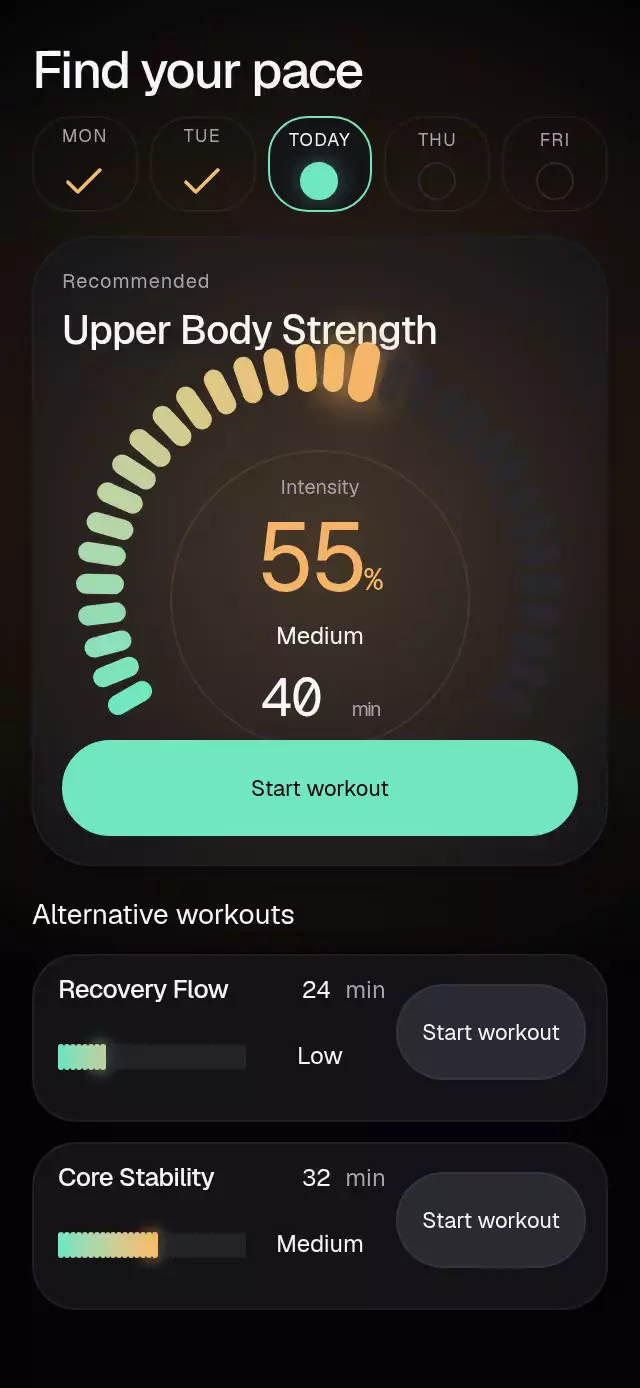
About this animation
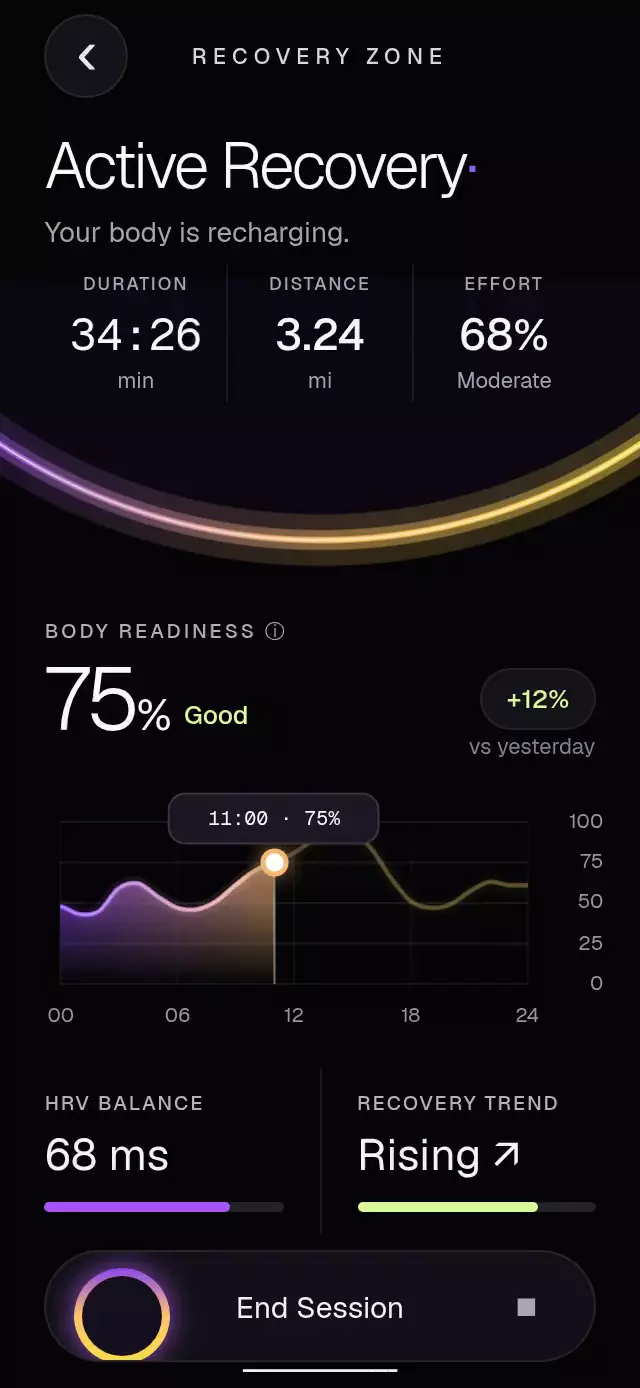
A recovery dashboard with a scrubbable readiness curve and configurable series, metrics, chart colors, and title font.
Why this one
Readiness charts are usually static. Here, scrubbing the curve updates the headline score and marker together while the planetary horizon anchors the whole recovery session.
How it works
- Measure the chart and build hourly Catmull–Rom curve segments in Skia.
- Evaluate those same segments for the scrub marker and its value label.
- Keep the marker on a shared progress value; release springs it back to
currentHour. - Update the elapsed clock from the session start time and render the supplied progress bars.
- Complete the session through the end slider or public ref and report
onEndto the host.
Install
Copy the files listed in piece.json into your project. Install SDK-compatible dependencies:
npx expo install @shopify/react-native-skia expo-linear-gradient react-native-gesture-handler react-native-reanimated react-native-workletsMount below a GestureHandlerRootView and load host fonts before rendering. Initialize CanvasKit before mounting Skia on web.
Usage
<RecoveryReadinessChart
  readiness={74}
  series={[46, 43, 49, 61, 65, 52, 46, 49, 61, 73, 78, 84, 91, 96, 89, 76, 61, 50, 45, 48, 55, 64, 67, 60]}
  onScrub={(hour, value) => console.log(hour, value)}
  onEnd={() => saveSession()}
/>
Props
| Prop | Type | Default | Description |
|---|---|---|---|
title | string | 'Active Recovery' | Main session heading. |
subtitle | string | 'Your body is recharging.' | Supporting session copy. |
titleFontFamily | string | 'Geist_300Light' | Display title font; load it in the host or supply a host-loaded family. |
zoneLabel | string | 'RECOVERY ZONE' | Centered navigation label. |
metrics | RecoveryMetric[] | Three metrics listed below | Summary headings, values, and units; duration updates from the session clock. |
startedAt | Date | Mount time minus 34 min 26 sec | Session start used to calculate live elapsed duration. |
readiness | number | 74 | Resting readiness score from 0 to 100. |
readinessLabel | string | 'Good' | Readiness descriptor and chart accessibility label. |
delta | string | '+12%' | Displayed change from the previous day. |
series | number[] | 24 hourly values listed below | Hourly curve data; supply 24 readiness scores from 0 to 100. |
bars | RecoveryBar[] | Two bars listed below | Lower progress summaries with labels, display values, progress, and colors. |
endLabel | string | 'End Session' | Active session slider text and accessible name. |
savedLabel | string | 'Session saved' | Completed slider text and accessible name. |
colors | { gradient: [string, string, ...string[]]; accent: string; background: string } | Palette listed below | Complete gradient and surface override; supply every field. |
onInteractionStart | () => void | undefined | Called when chart touch or accessibility interaction starts; stop host autoplay here. |
onEnd | () => void | undefined | Notifies the host when the slider or ref completes the session. |
currentHour | number | Current local hour | Marker rest position, clamped to 0–23. |
onScrub | (hour: number, value: number) => void | undefined | Reports the requested fractional hour and rounded smooth-curve score. |
Data and palette defaults
RecoveryMetric is { label: string; value: string; unit: string }. Default metrics are { label: 'DURATION', value: '34:26', unit: 'min' }, { label: 'DISTANCE', value: '3.24', unit: 'mi' }, and { label: 'EFFORT', value: '68%', unit: 'Moderate' }.
RecoveryBar is { label: string; value: string; progress: number; color: string }. Default bars are { label: 'HRV BALANCE', value: '68 ms', progress: 0.78, color: '#A855F7' } and { label: 'RECOVERY TREND', value: 'Rising ↗', progress: 0.76, color: '#D9F99D' }.
The default series is [48, 43, 45, 59, 62, 54, 47, 46, 51, 61, 70, 75, 81, 89, 95, 94, 83, 65, 51, 47, 49, 57, 63, 61]. Default colors is { gradient: ['#8B46EE', '#FFC46B', '#F8DC47'], accent: '#8B5CF6', background: '#050507' }.
Ref
Pass ref={sessionRef} with useRef<RecoveryReadinessChartRef>(null). The optional ref has no default and exposes scrubTo(hour: number): void, release(): void to return to the resting hour, end(): void to complete and call onEnd, and reset(): void to restore the active session and resting marker. Import the component and ref type from this folder's index.ts.
Chart interaction
The marker evaluates the same hourly Catmull–Rom cubic segments as the rendered curve, including during its interruptible spring return to currentHour. The white marker has a gradient-colored ring and soft halo; its guide ends at the bottom axis. A bounded floating label shows 24-hour time and the rounded curve value. Future data is dimmed through two complementary clips.
onInteractionStart?: () => void fires when chart touch or accessibility interaction starts, so external playback can stop. The demo stops its autoplay timers on interaction. scrubTo(hour) accepts fractional hours; onScrub reports the rounded smooth-curve value. Reduced motion moves directly to the requested hour.
The screen caps its content width at 480 pt. Containers shorter than 680 pt scroll vertically so the chart, floating label, axes, and session control retain their spacing. The host screen applies safe-area insets.
Compatibility
- Expo SDK 58
- React Native 0.88
- iOS, Android, and web
Accessibility
The chart exposes an adjustable role, the readiness label and value, and increment/decrement actions as an alternative to scrubbing. The session control exposes a button role and uses endLabel or savedLabel as its accessible name. Reduced motion places the chart marker directly at the requested hour and skips the entrance travel; the session slider retains its spring.