React Native Chart Animations
Browse React Native chart animations for interactive dashboards, changing metrics, and accessible data exploration in Expo.
Loading animations…
Searching in Chart Animations · Search all animations
Popular patterns
10 animations
 $9 for this animation
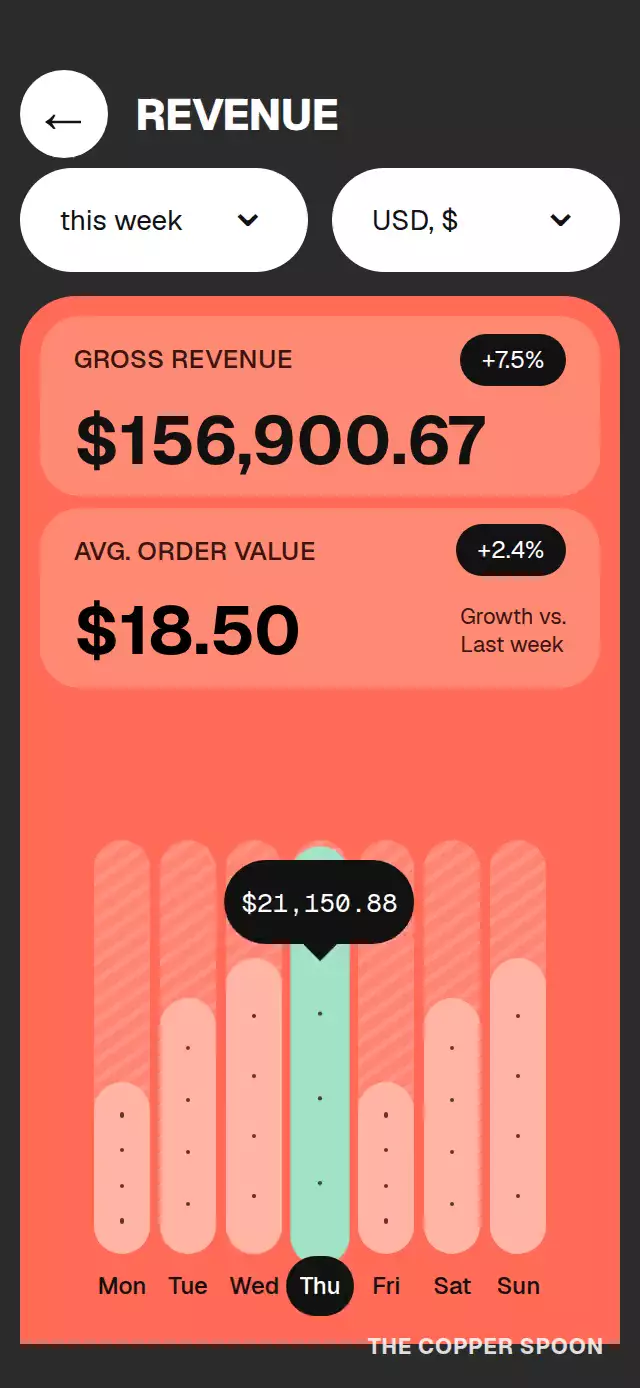
Revenue Bar Scrubber
An interactive revenue chart with draggable daily values and configurable chart colors, labels, periods, and money formatting.
 $9 for this animation
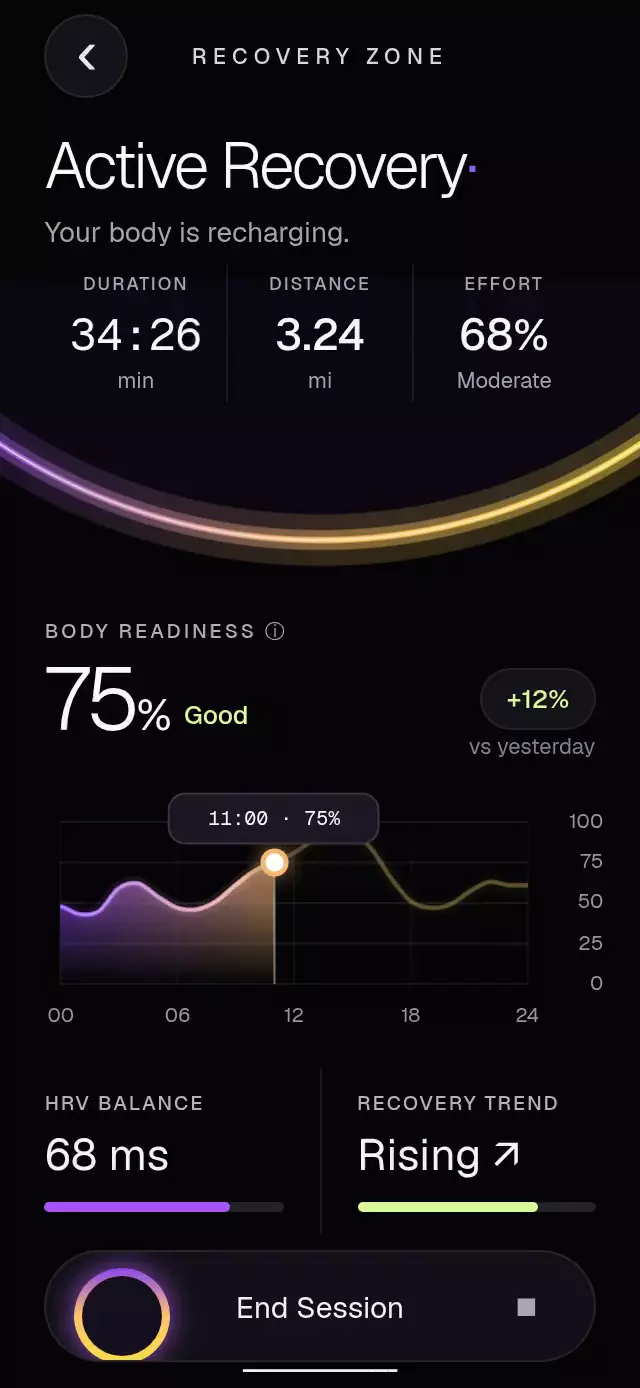
Recovery Readiness Chart
A recovery dashboard with a scrubbable readiness curve and configurable series, metrics, chart colors, and title font.
 $9 for this animation
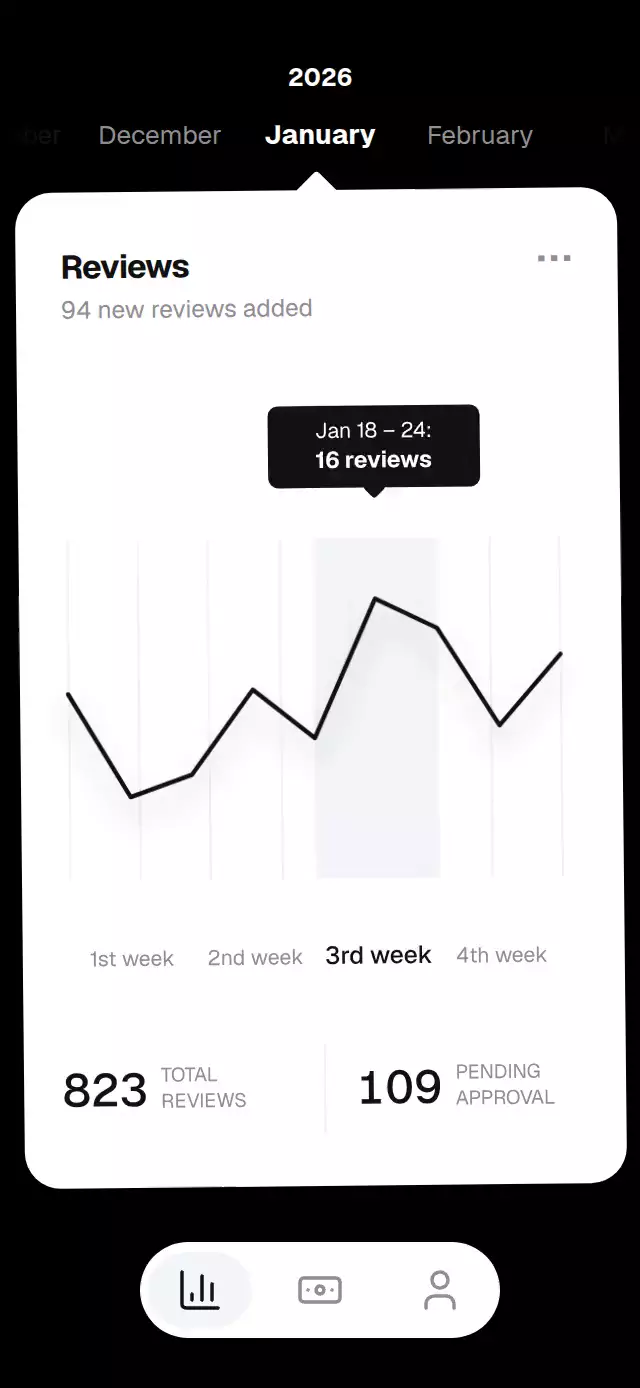
Review Insights Chart
A review dashboard with a month carousel and morphing line chart, with configurable monthly data, labels, colors, and fonts.
 $9 for this animation
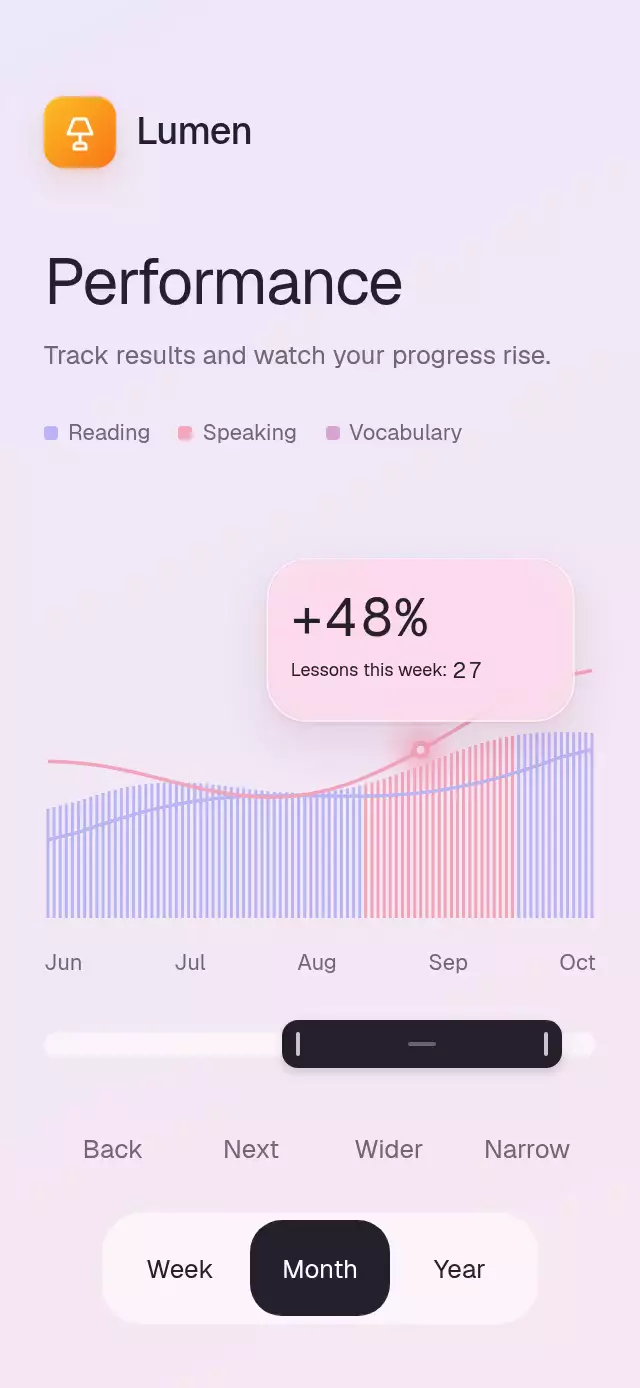
Range Scrub Performance
A performance chart with a draggable range window and following insight bubble, with configurable series, labels, colors, and fonts.
 $9 for this animation
Pulse Heart Dashboard
A heart-rate dashboard with synchronized beats and expanding charts, with configurable heart image, health stats, colors, and fonts.
 $9 for this animation
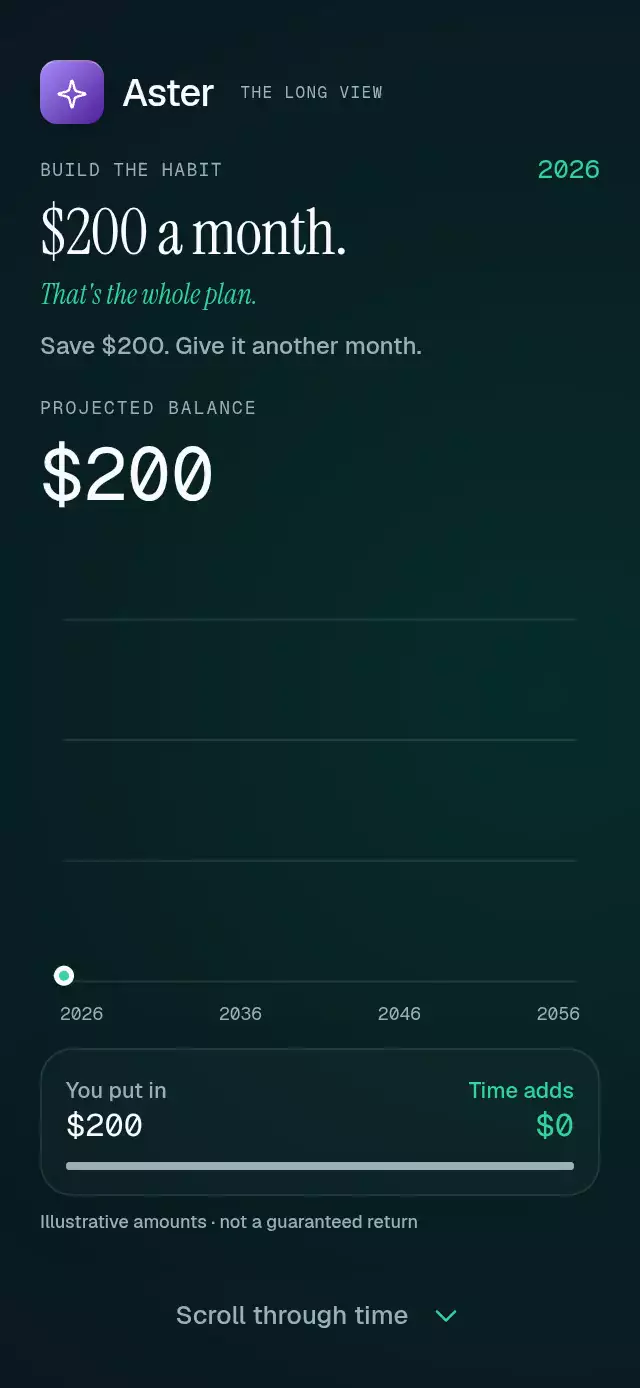
Compound Growth Scroll
A scroll-driven savings story with a rolling balance and growth curve, with configurable chapters, labels, accent color, and fonts.
 $9 for this animation
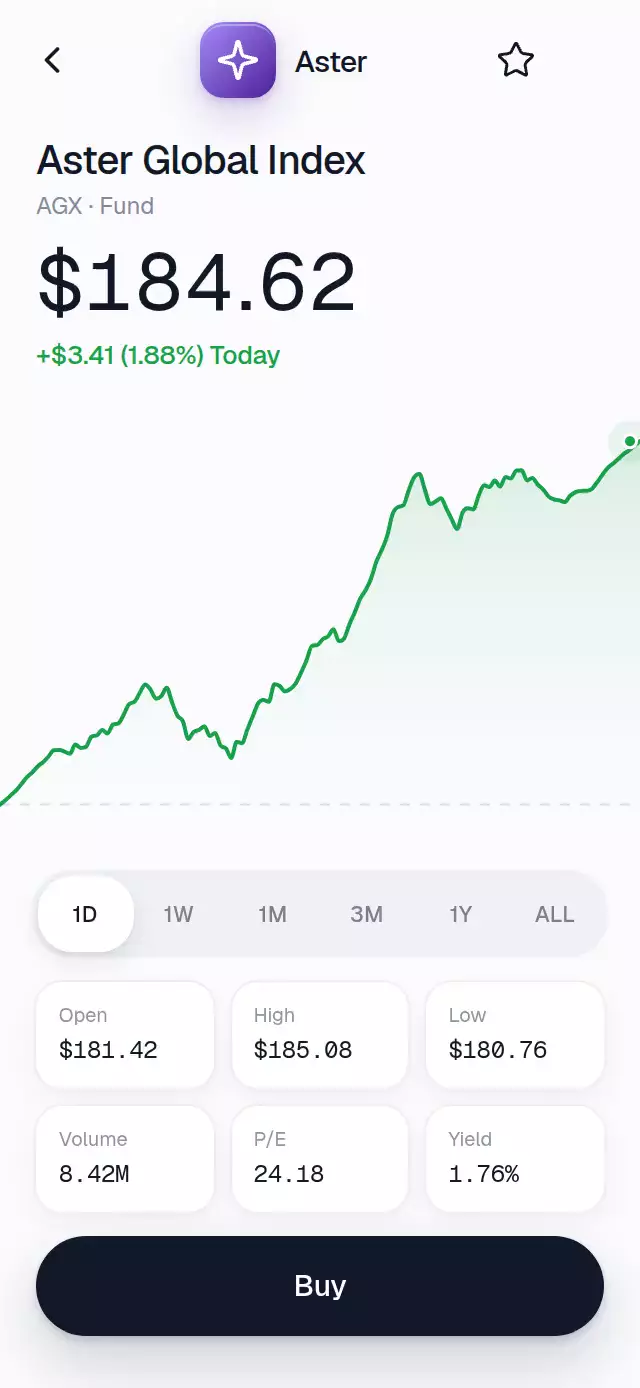
Stock Chart Scrubber
A market chart with a draggable cursor and morphing ranges, with configurable price, stats, positive-value color, and fonts.
 $9 for this animation
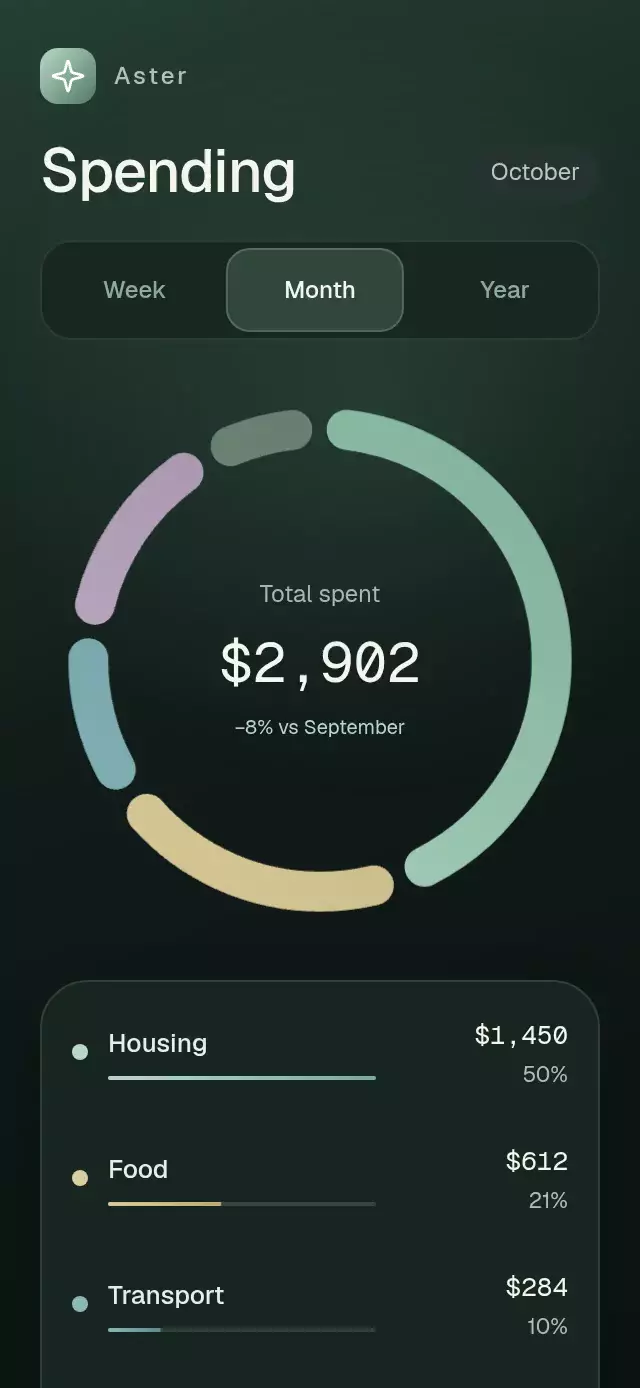
Donut Spend Breakdown
A spending donut with animated period changes and category selection, with configurable categories, copy, fonts, and accent color.
 $9 for this animation
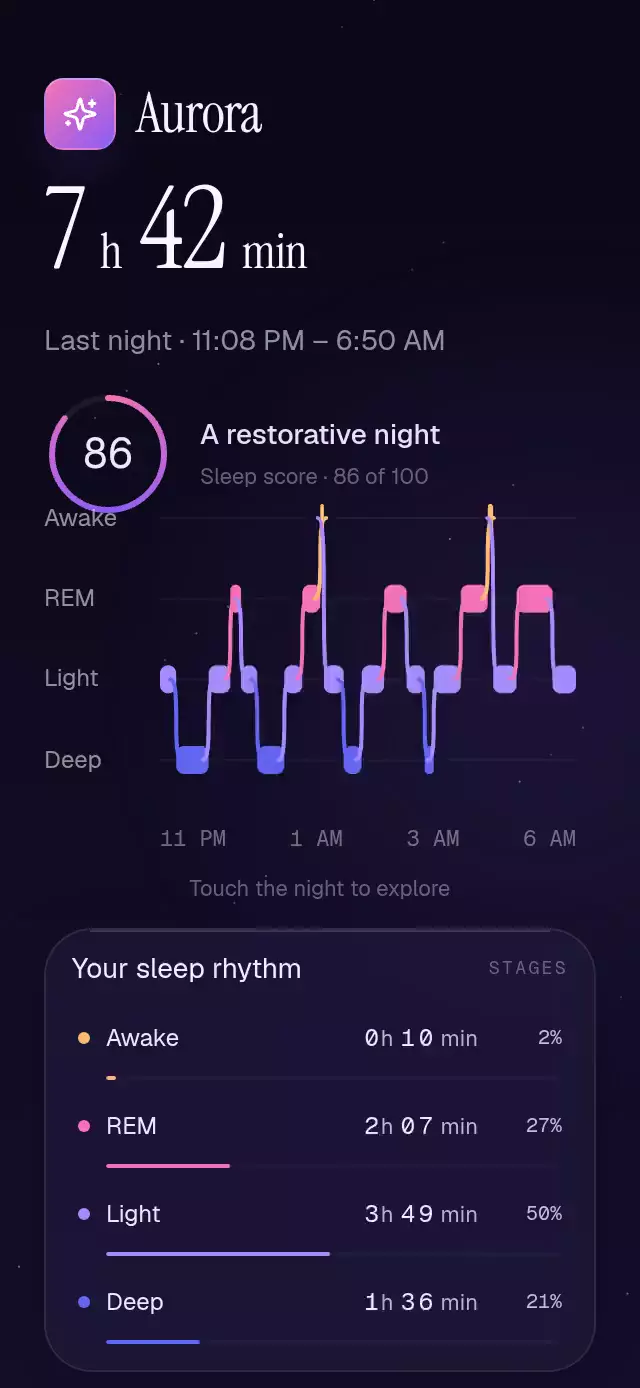
Sleep stages chart
A sleep-stage chart with rolling totals and a linked inspection cursor, with configurable segments, start time, stage colors, and fonts.
 $9 for this animation
Counting Bar Chart
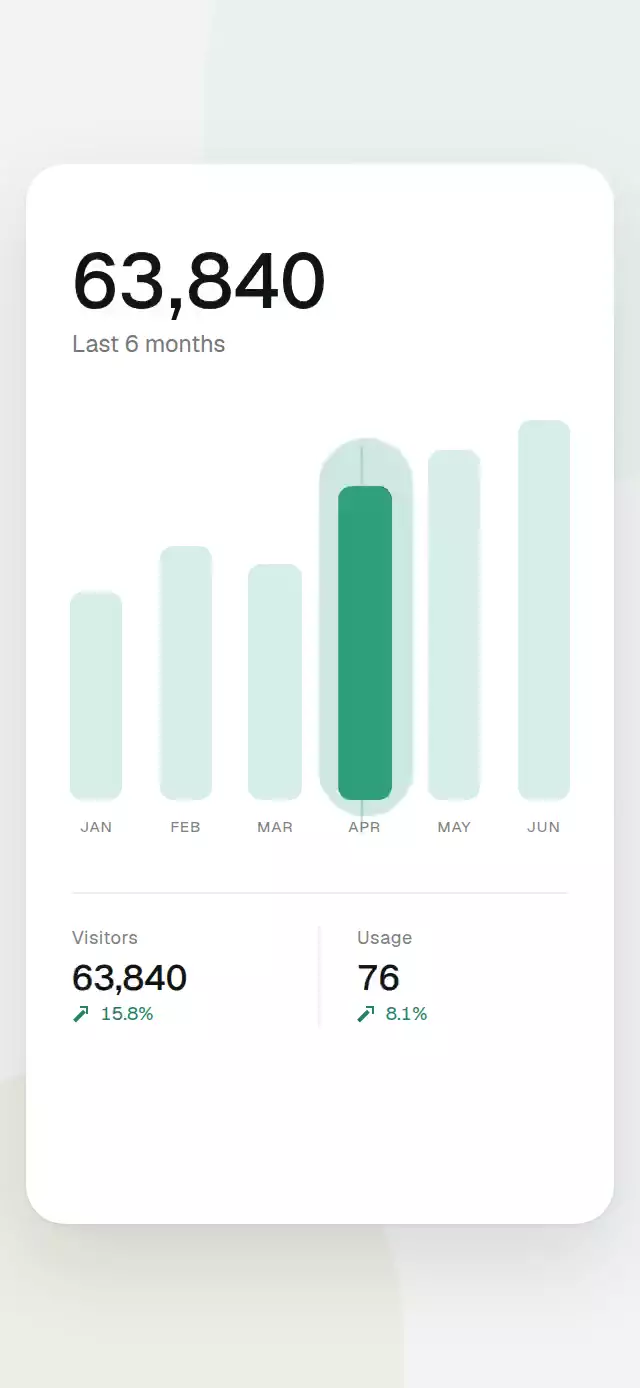
A bar chart with growing bars, a rolling total, and draggable detail, with configurable data, headings, bar color, and fonts.
About this collection
React Native chart animations need to preserve the data story while adding enough motion to explain change. A bar that grows from its baseline, a guide that follows selection, or a number that rolls only when its value changes can make a compact dashboard easier to scan. This category collects source-owned Expo components for animated statistics, progress, and data exploration. Reanimated keeps visual interpolation and selection feedback on the UI thread, while Gesture Handler can map taps and drags to the same continuous interaction path. Each piece includes an accessible semantic model so screen-reader users can move through values without relying on visual position or color. The Native Animation CLI copies the implementation and README into your project, allowing you to replace sample data, format values, tune colors and fonts, and connect callbacks directly to application state. A public hub appears once three chart pieces are published, avoiding a thin category with too few useful examples.
Related guides
More collections
- React Native Skia Examples for Expo
- React Native Carousel Examples for Expo
- React Native Value Selectors
- React Native Button Animations
- React Native Onboarding Animations
- React Native Loading Animation Examples
- React Native Liquid Glass Animations
- React Native Micro-interactions
- React Native Halloween Animations
- React Native Black Friday and Sale Animations
- React Native Year in Review Animations
- React Native Holiday Animations