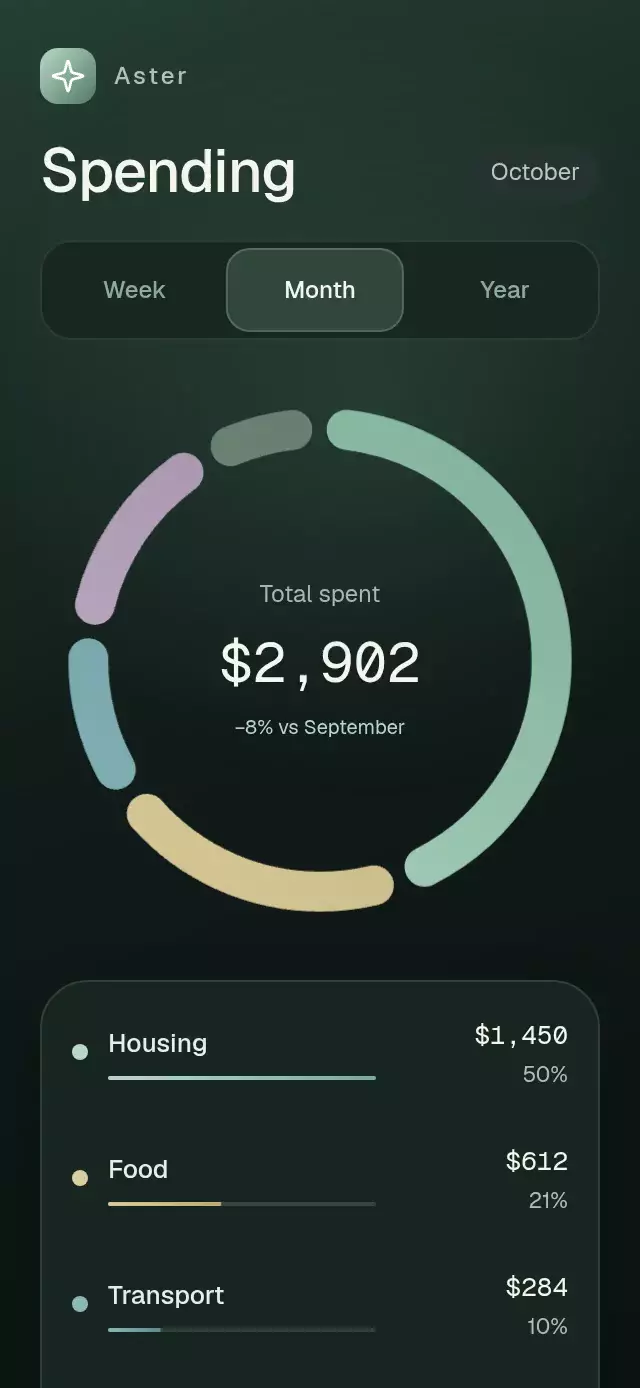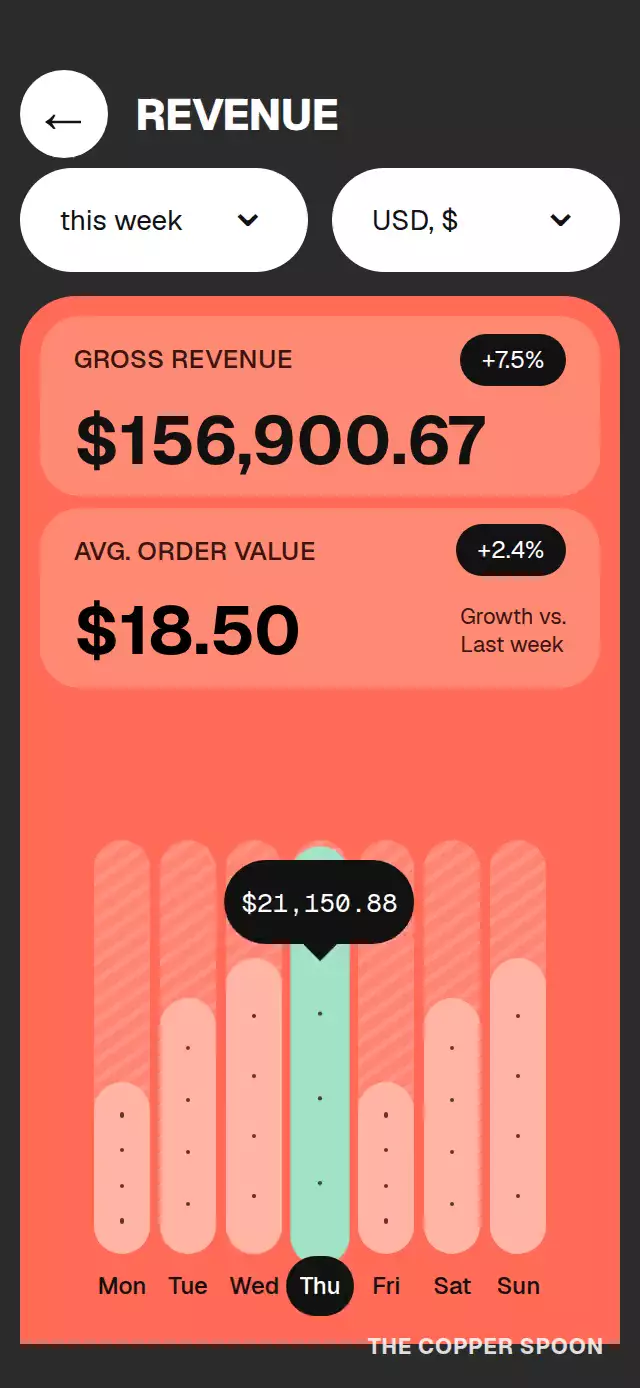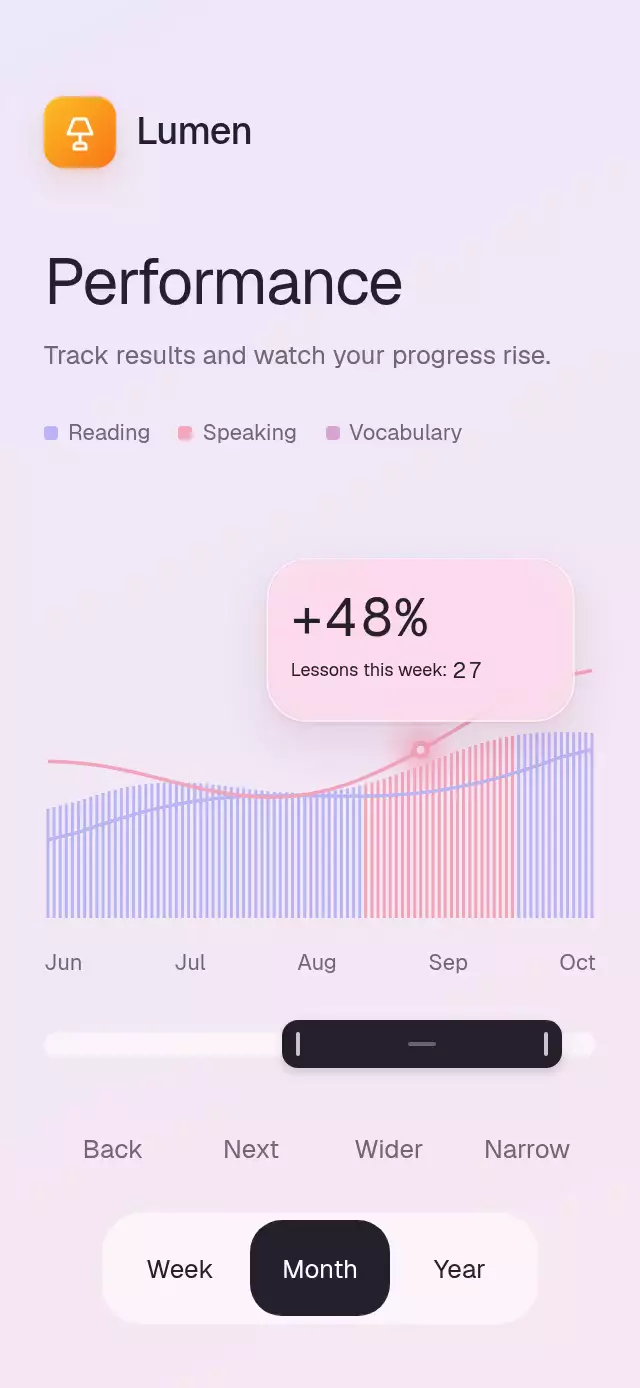
About this animation
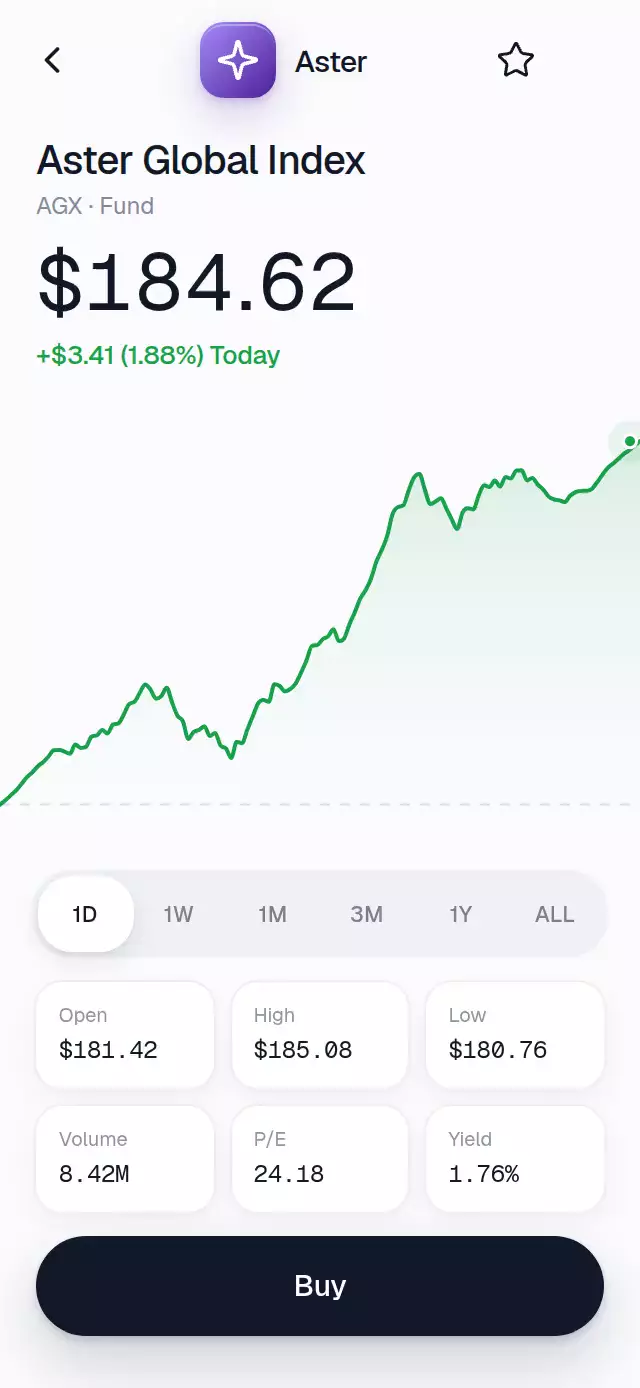
A market chart with a draggable cursor and morphing ranges, with configurable price, stats, positive-value color, and fonts.
Why this one
Most chart demos treat the line, cursor, and headline as separate effects. This component keeps them on one continuous data model: scrubbing dims only the future segment, moves the halo along the actual curve, and updates the headline in the same frame. Range changes resample every series to 120 points, so the line can morph without popping, while the dashed previous-close rail and deterministic market texture keep the result useful rather than decorative.
How it works
- Six deterministic data sets are resampled to 120 points and converted to monotone cubic paths, avoiding overshoot between market values.
- One shared range progress interpolates the old and new Skia paths, point values, reference geometry, and positive-or-negative accent color.
- A continuous cursor shared value drives the vertical guide, halo, date bubble, live price, variation, and the 30% future-line treatment.
- Pan, tap, accessibility actions, range buttons, and the imperative ref all write to the same interruptible values.
- The initial reveal draws the line from left to right, then sweeps the cursor across it before returning to the latest value.
The headline uses fixed-width tabular digit columns and narrower, centered decimal and thousands separators. All price glyphs share the same line metrics and native text primitive; punctuation uses fontFamily, while digits use monoFontFamily.
Install
npx expo install @shopify/react-native-skia expo-linear-gradient react-native-gesture-handler react-native-reanimated react-native-workletsWrap the application with GestureHandlerRootView as described by React Native Gesture Handler. Skia web applications also need CanvasKit initialized before loading this component.
Usage
import StockChartScrubber from './StockChartScrubber';

export function FundScreen() {
  return <StockChartScrubber title="Global Index" price={184.62} />;
}
Customize the content, color, callbacks, and controls:
import { useRef } from 'react';
import StockChartScrubber, {
  type StockChartScrubberRef,
} from './StockChartScrubber';

export function FundScreen() {
  const chartRef = useRef<StockChartScrubberRef>(null);

  return (
    <StockChartScrubber
      ref={chartRef}
      title="Balanced Market Fund"
      subtitle="BMF · Fund"
      price={126.84}
      previousClose={124.92}
      initialRange="1M"
      positiveColor="#0F9F6E"
      negativeColor="#D33F49"
      onRangeChange={(range) => trackRange(range)}
      onBuyPress={openOrderSheet}
    />
  );
}
The forwarded ref exposes play(), resetCursor(), and selectRange(range).
Props
| Prop | Type | Default | Description |
|---|---|---|---|
title | string | 'Global Index' | Product name. |
subtitle | string | 'IDX · Fund' | Compact ticker and security type. |
brandName | string | 'Portfolio' | Brand name beside the app tile. |
price | number | 184.62 | Initial price used to generate the deterministic series. |
previousClose | number | 181.21 | Previous close used for the reference line. |
initialRange | StockChartRange | '1D' | Initially selected range. |
stats | StockChartStat[] | DEFAULT_STATS | Six summary statistics shown below the chart. |
positiveColor | string | '#16A34A' | Positive chart color. |
negativeColor | string | '#DC2626' | Negative chart color. |
backgroundColor | string | '#FBFBFD' | Main screen background. |
textColor | string | '#111827' | Primary text color. |
fontFamily | string | undefined | Regular interface font family. |
mediumFontFamily | string | undefined | Medium interface font family. |
monoFontFamily | string | undefined | Monospaced font family for changing figures. |
onRangeChange | (range: StockChartRange) => void | undefined | Called when the selected range changes. |
onCursorChange | (index: number | null) => void | undefined | Called with the scrubbed point index, or null when released. |
onBuyPress | () => void | undefined | Called when the buy button is pressed. |
onBackPress | () => void | undefined | Called when the back button is pressed. |
onWatchlistPress | () => void | undefined | Called when the watchlist button is pressed. |
chartAccessibilityLabel | string | 'Price chart' | Screen-reader label for the chart. |
style | StyleProp<ViewStyle> | undefined | Optional style for the outer container. |
testID | string | undefined | Test identifier applied to the outer container. |
duration | number | 1450 | Active chart pulse cycle in milliseconds. Spring physics and reduced-motion timing are unchanged. |
Compatibility
- Expo SDK 58
- React Native 0.88.0
- Reanimated 4.7.1 and Worklets 0.13.0
- Skia 2.14.0
- iOS and Android: supported
- Web: supported
- Expo Go: supported by the SDK 58 bundled modules
- Icons: Lucide (ISC)
Accessibility
The chart is an adjustable control with increment and decrement actions, and tapping is an alternative to dragging. All controls have at least 44-point hit areas and descriptive labels. Reduced Motion replaces springs and the range morph with short fades, disables the endpoint pulse, and skips the automated cursor sweep.